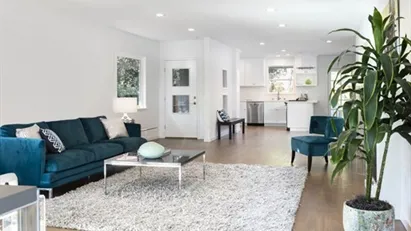
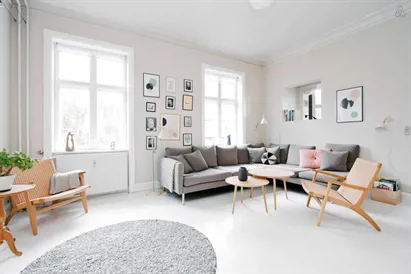
Ca. 70 m2 apartment for rent in Risskov, Aarhus, Rolighedsvej
10 h ago
Ca. 70 m2 apartment for rent in Risskov, Aarhus, Rolighedsvej
Ca. 70 m2 apartment for rent in Risskov, Aarhus, Rolighedsvej
Ca. 70 m2 apartment for rent in Risskov, Aarhus, Rolighedsvej
Ca. 70 m2 Rooms 3
Ca. 70 m2 apartment for rent in Risskov, Aarhus, Rolighedsvej
More info
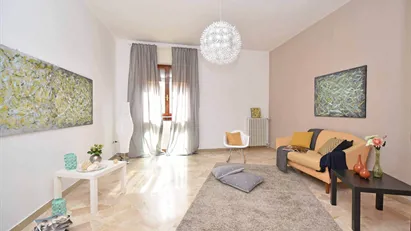
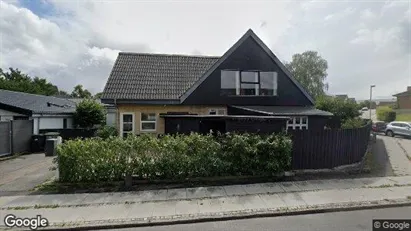
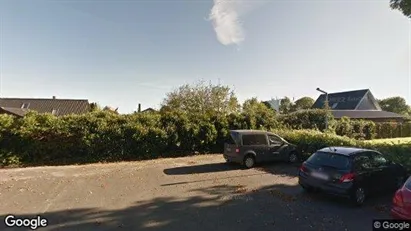
Ca. 115 m2 house for rent in Tilst, Aarhus, Honningvænget
18 h ago
Ca. 115 m2 house for rent in Tilst, Aarhus, Honningvænget
Ca. 115 m2 house for rent in Tilst, Aarhus, Honningvænget
Ca. 115 m2 house for rent in Tilst, Aarhus, Honningvænget
Ca. 115 m2 Rooms 4
Ca. 115 m2 house for rent in Tilst, Aarhus, Honningvænget
More info
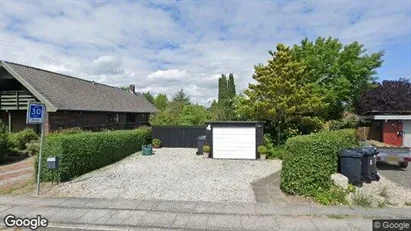
Ca. 115 m2 house for rent in Tilst, Aarhus, Honningvænget
18 h ago
Ca. 115 m2 house for rent in Tilst, Aarhus, Honningvænget
Ca. 115 m2 house for rent in Tilst, Aarhus, Honningvænget
Ca. 115 m2 house for rent in Tilst, Aarhus, Honningvænget
Ca. 115 m2 Rooms 4
Ca. 115 m2 house for rent in Tilst, Aarhus, Honningvænget
More info
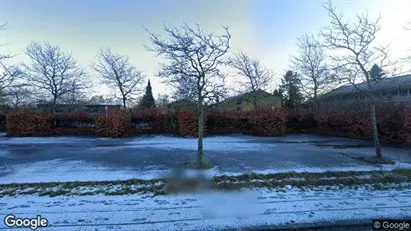
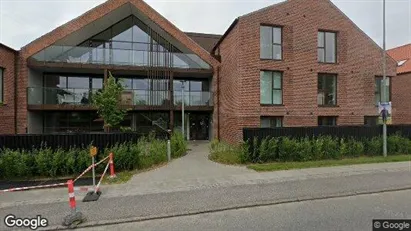
Ca. 55 m2 apartment for rent in Aarhus C, Aarhus, Janus La Cours Gade
18 h ago
Ca. 55 m2 apartment for rent in Aarhus C, Aarhus, Janus La Cours Gade
Ca. 55 m2 apartment for rent in Aarhus C, Aarhus, Janus La Cours Gade
Ca. 55 m2 apartment for rent in Aarhus C, Aarhus, Janus La Cours Gade
Ca. 55 m2 Rooms 2
Ca. 55 m2 apartment for rent in Aarhus C, Aarhus, Janus La Cours Gade
More info
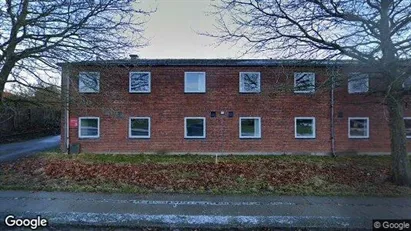
Apartment for rent in Aarhus V, Aarhus, Kalendervej
18 h ago
Apartment for rent in Aarhus V, Aarhus, Kalendervej
Apartment for rent in Aarhus V, Aarhus, Kalendervej
Apartment for rent in Aarhus V, Aarhus, Kalendervej
Apartment for rent in Aarhus V, Aarhus, Kalendervej
More info
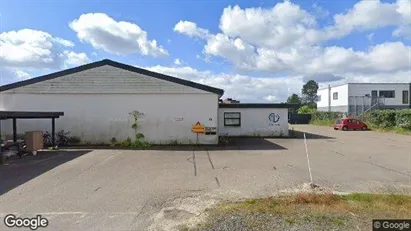
Ca. 60 m2 apartment for rent in Risskov, Aarhus, Agerbæksvej
1 d ago
Ca. 60 m2 apartment for rent in Risskov, Aarhus, Agerbæksvej
Ca. 60 m2 apartment for rent in Risskov, Aarhus, Agerbæksvej
Ca. 60 m2 apartment for rent in Risskov, Aarhus, Agerbæksvej
Ca. 60 m2 Rooms 2
Ca. 60 m2 apartment for rent in Risskov, Aarhus, Agerbæksvej
More info
Ca. 50 m2 apartment for rent in Viby J, Aarhus, Damagervej
1 d ago
Ca. 50 m2 apartment for rent in Viby J, Aarhus, Damagervej
Ca. 50 m2 apartment for rent in Viby J, Aarhus, Damagervej
Ca. 50 m2 apartment for rent in Viby J, Aarhus, Damagervej
Ca. 50 m2 Rooms 2
Ca. 50 m2 apartment for rent in Viby J, Aarhus, Damagervej
More info
Ca. 40 m2 apartment for rent in Risskov, Aarhus, Vestre Strandallé
1 d ago
Ca. 40 m2 apartment for rent in Risskov, Aarhus, Vestre Strandallé
Ca. 40 m2 apartment for rent in Risskov, Aarhus, Vestre Strandallé
Ca. 40 m2 apartment for rent in Risskov, Aarhus, Vestre Strandallé
Ca. 40 m2 Rooms 1
Ca. 40 m2 apartment for rent in Risskov, Aarhus, Vestre Strandallé
More info
Ca. 35 m2 apartment for rent in Åbyhøj, Aarhus, Søren Frichs Vej
1 d ago
Ca. 35 m2 apartment for rent in Åbyhøj, Aarhus, Søren Frichs Vej
Ca. 35 m2 apartment for rent in Åbyhøj, Aarhus, Søren Frichs Vej
Ca. 35 m2 apartment for rent in Åbyhøj, Aarhus, Søren Frichs Vej
Ca. 35 m2 Rooms 1
Ca. 35 m2 apartment for rent in Åbyhøj, Aarhus, Søren Frichs Vej
More info
Ca. 60 m2 apartment for rent in Risskov, Aarhus, Agerbæksvej
1 d ago
Ca. 60 m2 apartment for rent in Risskov, Aarhus, Agerbæksvej
Ca. 60 m2 apartment for rent in Risskov, Aarhus, Agerbæksvej
Ca. 60 m2 apartment for rent in Risskov, Aarhus, Agerbæksvej
Ca. 60 m2 Rooms 2
Ca. 60 m2 apartment for rent in Risskov, Aarhus, Agerbæksvej
More info
Ca. 50 m2 apartment for rent in Risskov, Aarhus, Arresøvej
1 d ago
Ca. 50 m2 apartment for rent in Risskov, Aarhus, Arresøvej
Ca. 50 m2 apartment for rent in Risskov, Aarhus, Arresøvej
Ca. 50 m2 apartment for rent in Risskov, Aarhus, Arresøvej
Ca. 50 m2 Rooms 2
Ca. 50 m2 apartment for rent in Risskov, Aarhus, Arresøvej
More info
Ca. 60 m2 apartment for rent in Risskov, Aarhus, Agerbæksvej
1 d ago
Ca. 60 m2 apartment for rent in Risskov, Aarhus, Agerbæksvej
Ca. 60 m2 apartment for rent in Risskov, Aarhus, Agerbæksvej
Ca. 60 m2 apartment for rent in Risskov, Aarhus, Agerbæksvej
Ca. 60 m2 Rooms 2
Ca. 60 m2 apartment for rent in Risskov, Aarhus, Agerbæksvej
More info
Ca. 55 m2 apartment for rent in Egå, Aarhus, Brobjerg Parkvej
1 d ago
Ca. 55 m2 apartment for rent in Egå, Aarhus, Brobjerg Parkvej
Ca. 55 m2 apartment for rent in Egå, Aarhus, Brobjerg Parkvej
Ca. 55 m2 apartment for rent in Egå, Aarhus, Brobjerg Parkvej
Ca. 55 m2 Rooms 2
Ca. 55 m2 apartment for rent in Egå, Aarhus, Brobjerg Parkvej
More info
Ca. 30 m2 apartment for rent in Viby J, Aarhus, Christian Xs vej
1 d ago
Ca. 30 m2 apartment for rent in Viby J, Aarhus, Christian Xs vej
Ca. 30 m2 apartment for rent in Viby J, Aarhus, Christian Xs vej
Ca. 30 m2 apartment for rent in Viby J, Aarhus, Christian Xs vej
Ca. 30 m2 Rooms 1
Ca. 30 m2 apartment for rent in Viby J, Aarhus, Christian Xs vej
More info
Ca. 65 m2 apartment for rent in Risskov, Aarhus, F.K. Hallagers Gade
1 d ago
Ca. 65 m2 apartment for rent in Risskov, Aarhus, F.K. Hallagers Gade
Ca. 65 m2 apartment for rent in Risskov, Aarhus, F.K. Hallagers Gade
Ca. 65 m2 apartment for rent in Risskov, Aarhus, F.K. Hallagers Gade
Ca. 65 m2 Rooms 2
Ca. 65 m2 apartment for rent in Risskov, Aarhus, F.K. Hallagers Gade
More info
Ca. 70 m2 apartment for rent in Risskov, Aarhus, Tretommervej
1 d ago
Ca. 70 m2 apartment for rent in Risskov, Aarhus, Tretommervej
Ca. 70 m2 apartment for rent in Risskov, Aarhus, Tretommervej
Ca. 70 m2 apartment for rent in Risskov, Aarhus, Tretommervej
Ca. 70 m2 Rooms 3
Ca. 70 m2 apartment for rent in Risskov, Aarhus, Tretommervej
More info
Apartment for rent in Aarhus N, Aarhus, Valnøddevej
1 d ago
Apartment for rent in Aarhus N, Aarhus, Valnøddevej
Apartment for rent in Aarhus N, Aarhus, Valnøddevej
Apartment for rent in Aarhus N, Aarhus, Valnøddevej
Apartment for rent in Aarhus N, Aarhus, Valnøddevej
More info
Ca. 120 m2 apartment for rent in Risskov, Aarhus, F.K. Hallagers Gade
1 d ago
Ca. 120 m2 apartment for rent in Risskov, Aarhus, F.K. Hallagers Gade
Ca. 120 m2 apartment for rent in Risskov, Aarhus, F.K. Hallagers Gade
Ca. 120 m2 apartment for rent in Risskov, Aarhus, F.K. Hallagers Gade
Ca. 120 m2 Rooms 4
Ca. 120 m2 apartment for rent in Risskov, Aarhus, F.K. Hallagers Gade
More info