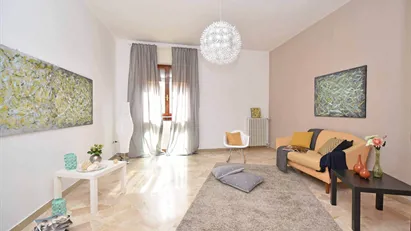
Ca. 155 m2 house for rent in Gentofte, Greater Copenhagen, Kærmindevej
13 h ago
Ca. 155 m2 house for rent in Gentofte, Greater Copenhagen, Kærmindevej
Ca. 155 m2 house for rent in Gentofte, Greater Copenhagen, Kærmindevej
Ca. 155 m2 house for rent in Gentofte, Greater Copenhagen, Kærmindevej
Ca. 155 m2 Rooms 4
Ca. 155 m2 house for rent in Gentofte, Greater Copenhagen, Kærmindevej
More info
Ca. 100 m2 house for rent in Skævinge, North Zealand, Dyremosegård Park
18 h ago
Ca. 100 m2 house for rent in Skævinge, North Zealand, Dyremosegård Park
Ca. 100 m2 house for rent in Skævinge, North Zealand, Dyremosegård Park
Ca. 100 m2 house for rent in Skævinge, North Zealand, Dyremosegård Park
Ca. 100 m2
Ca. 100 m2 house for rent in Skævinge, North Zealand, Dyremosegård Park
More info
Ca. 85 m2 house for rent in Skævinge, North Zealand, Dyremosegård Park
1 d ago
Ca. 85 m2 house for rent in Skævinge, North Zealand, Dyremosegård Park
Ca. 85 m2 house for rent in Skævinge, North Zealand, Dyremosegård Park
Ca. 85 m2 house for rent in Skævinge, North Zealand, Dyremosegård Park
Ca. 85 m2
Ca. 85 m2 house for rent in Skævinge, North Zealand, Dyremosegård Park
More info
Ca. 85 m2 house for rent in Skævinge, North Zealand, Dyremosegård Park
1 d ago
Ca. 85 m2 house for rent in Skævinge, North Zealand, Dyremosegård Park
Ca. 85 m2 house for rent in Skævinge, North Zealand, Dyremosegård Park
Ca. 85 m2 house for rent in Skævinge, North Zealand, Dyremosegård Park
Ca. 85 m2 Rooms 3
Ca. 85 m2 house for rent in Skævinge, North Zealand, Dyremosegård Park
More info
Ca. 110 m2 house for rent in Birkerød, North Zealand, Teglgården
1 d ago
Ca. 110 m2 house for rent in Birkerød, North Zealand, Teglgården
Ca. 110 m2 house for rent in Birkerød, North Zealand, Teglgården
Ca. 110 m2 house for rent in Birkerød, North Zealand, Teglgården
Ca. 110 m2 Rooms 4
Ca. 110 m2 house for rent in Birkerød, North Zealand, Teglgården
More info
Ca. 240 m2 house for rent in Fredensborg, North Zealand, Lillevangsvej
30 d ago
Ca. 240 m2 house for rent in Fredensborg, North Zealand, Lillevangsvej
Ca. 240 m2 house for rent in Fredensborg, North Zealand, Lillevangsvej
Ca. 240 m2 house for rent in Fredensborg, North Zealand, Lillevangsvej
Ca. 240 m2 Rooms 6
Ca. 240 m2 house for rent in Fredensborg, North Zealand, Lillevangsvej
More info
Ca. 140 m2 house for rent in Hillerød, North Zealand, Seminariehaven
2 d ago
Ca. 140 m2 house for rent in Hillerød, North Zealand, Seminariehaven
Ca. 140 m2 house for rent in Hillerød, North Zealand, Seminariehaven
Ca. 140 m2 house for rent in Hillerød, North Zealand, Seminariehaven
Ca. 140 m2 Rooms 5
Ca. 140 m2 house for rent in Hillerød, North Zealand, Seminariehaven
More info
Ca. 125 m2 house for rent in Helsinge, North Zealand, Ammendrup Park
1 mo ago
Ca. 125 m2 house for rent in Helsinge, North Zealand, Ammendrup Park
Ca. 125 m2 house for rent in Helsinge, North Zealand, Ammendrup Park
Ca. 125 m2 house for rent in Helsinge, North Zealand, Ammendrup Park
Ca. 125 m2 Rooms 4
Ca. 125 m2 house for rent in Helsinge, North Zealand, Ammendrup Park
More info
Ca. 105 m2 house for rent in Hillerød, North Zealand, Amtmandshave
1 mo ago
Ca. 105 m2 house for rent in Hillerød, North Zealand, Amtmandshave
Ca. 105 m2 house for rent in Hillerød, North Zealand, Amtmandshave
Ca. 105 m2 house for rent in Hillerød, North Zealand, Amtmandshave
Ca. 105 m2 Rooms 4
Ca. 105 m2 house for rent in Hillerød, North Zealand, Amtmandshave
More info
Ca. 100 m2 house for rent in Charlottenlund, Greater Copenhagen, Hyldegårdsvej
3 d ago
Ca. 100 m2 house for rent in Charlottenlund, Greater Copenhagen, Hyldegårdsvej
Ca. 100 m2 house for rent in Charlottenlund, Greater Copenhagen, Hyldegårdsvej
Ca. 100 m2 house for rent in Charlottenlund, Greater Copenhagen, Hyldegårdsvej
Ca. 100 m2
Ca. 100 m2 house for rent in Charlottenlund, Greater Copenhagen, Hyldegårdsvej
More info
Ca. 110 m2 house for rent in Helsingør, North Zealand, Lindehaven
3 d ago
Ca. 110 m2 house for rent in Helsingør, North Zealand, Lindehaven
Ca. 110 m2 house for rent in Helsingør, North Zealand, Lindehaven
Ca. 110 m2 house for rent in Helsingør, North Zealand, Lindehaven
Ca. 110 m2 Rooms 4
Ca. 110 m2 house for rent in Helsingør, North Zealand, Lindehaven
More info
Ca. 100 m2 house for rent in Skævinge, North Zealand, Dyremosegård Park
3 d ago
Ca. 100 m2 house for rent in Skævinge, North Zealand, Dyremosegård Park
Ca. 100 m2 house for rent in Skævinge, North Zealand, Dyremosegård Park
Ca. 100 m2 house for rent in Skævinge, North Zealand, Dyremosegård Park
Ca. 100 m2 Rooms 4
Ca. 100 m2 house for rent in Skævinge, North Zealand, Dyremosegård Park
More info
Ca. 180 m2 house for rent in Vedbæk, Greater Copenhagen, Frydenlunds Alle
3 d ago
Ca. 180 m2 house for rent in Vedbæk, Greater Copenhagen, Frydenlunds Alle
Ca. 180 m2 house for rent in Vedbæk, Greater Copenhagen, Frydenlunds Alle
Ca. 180 m2 house for rent in Vedbæk, Greater Copenhagen, Frydenlunds Alle
Ca. 180 m2 Rooms 6
Ca. 180 m2 house for rent in Vedbæk, Greater Copenhagen, Frydenlunds Alle
More info
Ca. 175 m2 house for rent in Helsinge, North Zealand, Granvej
1 mo ago
Ca. 175 m2 house for rent in Helsinge, North Zealand, Granvej
Ca. 175 m2 house for rent in Helsinge, North Zealand, Granvej
Ca. 175 m2 house for rent in Helsinge, North Zealand, Granvej
Ca. 175 m2 Rooms 6
Ca. 175 m2 house for rent in Helsinge, North Zealand, Granvej
More info
Ca. 195 m2 house for rent in Nærum, Greater Copenhagen, Skyttedal
1 mo ago
Ca. 195 m2 house for rent in Nærum, Greater Copenhagen, Skyttedal
Ca. 195 m2 house for rent in Nærum, Greater Copenhagen, Skyttedal
Ca. 195 m2 house for rent in Nærum, Greater Copenhagen, Skyttedal
Ca. 195 m2 Rooms 6
Ca. 195 m2 house for rent in Nærum, Greater Copenhagen, Skyttedal
More info
Ca. 105 m2 house for rent in Helsinge, North Zealand, Vej ikke angivet
1 d ago
Ca. 105 m2 house for rent in Helsinge, North Zealand, Vej ikke angivet
Ca. 105 m2 house for rent in Helsinge, North Zealand, Vej ikke angivet
Ca. 105 m2 house for rent in Helsinge, North Zealand, Vej ikke angivet
Ca. 105 m2 Rooms 4
Ca. 105 m2 house for rent in Helsinge, North Zealand, Vej ikke angivet
More info
Ca. 105 m2 house for rent in Helsinge, North Zealand, Vej ikke angivet
2 d ago
Ca. 105 m2 house for rent in Helsinge, North Zealand, Vej ikke angivet
Ca. 105 m2 house for rent in Helsinge, North Zealand, Vej ikke angivet
Ca. 105 m2 house for rent in Helsinge, North Zealand, Vej ikke angivet
Ca. 105 m2 Rooms 4
Ca. 105 m2 house for rent in Helsinge, North Zealand, Vej ikke angivet
More info